Pods on my K3s node stopped behaving normally. Some remained Pending, some surfaced ContainerStatusUnknown, and the node reported the node.kubernetes.io/disk-pressure taint. The immediate evidence was simple: the Linux root filesystem had reached 100% usage.
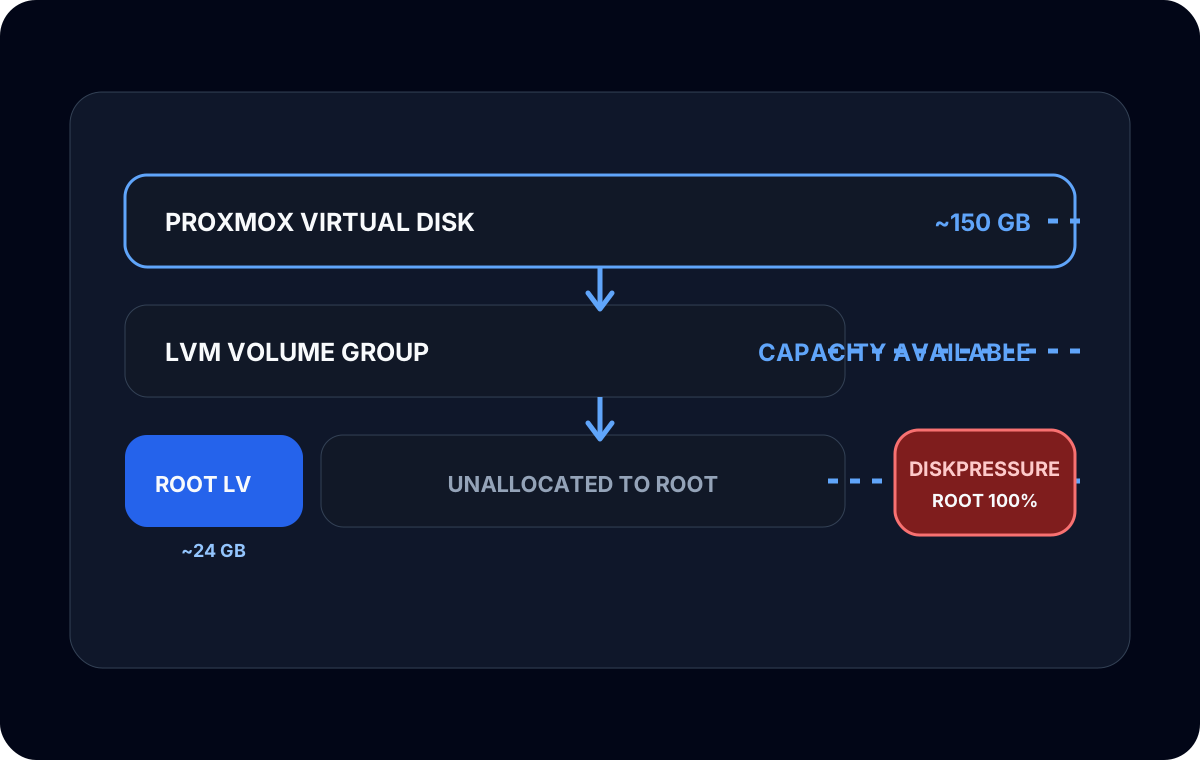
The confusing part was that Proxmox showed a virtual disk of roughly 150 GB. Inside the VM, df -h showed a root filesystem of only roughly 24 GB. Both views were correct; they described different layers.
Symptoms at the Kubernetes layer
I started where the failure appeared:
kubectl get pods --all-namespaces
kubectl describe node <node-name>
kubectl get events --all-namespaces --sort-by=.lastTimestamp
The node condition and taint pointed to DiskPressure. Kubernetes uses node-pressure signals for available bytes and inodes on node, image, or container filesystems. When a threshold is crossed, the kubelet can evict workloads and the scheduler avoids placing new pods on the affected node.
That explained the Kubernetes behavior, but not why a 150 GB VM was full.
The host told a different story
The next checks moved below Kubernetes:
df -h
lsblk
sudo pvs
sudo vgs
sudo lvs
df -h reports mounted filesystems. lsblk shows block devices, partitions, and mapped volumes. The LVM commands show how storage is divided into physical volumes, volume groups, and logical volumes.
Together, they showed the mismatch: Proxmox had made a much larger virtual disk available to the VM, but the root logical volume and filesystem still occupied only a small part of that capacity.
Six storage layers, not one disk-size number
The incident made more sense when I wrote the path explicitly.
| Layer | Role |
|---|---|
| Proxmox virtual disk | Capacity presented to the VM |
| Partition | Region of that virtual disk assigned for use |
| LVM physical volume | Storage LVM can manage |
| Volume group | Pool formed from one or more physical volumes |
| Logical volume | Allocated virtual block device, including the root LV |
| Filesystem | The structure mounted at / and measured by df |
Increasing capacity at an outer layer does not necessarily grow every layer inside it. The virtual disk can be 150 GB while the root filesystem remains 24 GB. Kubernetes only cares about the filesystem actually backing its data paths, not the unallocated capacity visible elsewhere.
Finding what consumed the root filesystem
Before changing storage layout, I also checked whether the immediate pressure came from logs, container images, application data, or another unexpected directory. Expanding a filesystem without understanding its growth can postpone the same incident.
K3s uses node storage for container images, writable layers, logs, and runtime data. A small root volume can fill faster than expected even when application databases live elsewhere. I avoided deleting runtime directories blindly; removing files underneath containerd or K3s without understanding ownership can create a second failure.
This investigation showed two valid findings at once: the root filesystem was genuinely full, and substantial virtual-disk capacity had not been allocated through the LVM and filesystem layers.
The safe expansion path
The repair followed the storage hierarchy:
Proxmox disk → partition → LVM physical volume → volume group → logical volume → filesystem
The exact expansion commands depend on the partition layout, LVM names, and filesystem type. I did not copy a generic sequence into production and hope the device names matched. I verified the VM backup position, identified each layer, and confirmed which filesystem was mounted at / before making changes.
Conceptually, the process was:
- Confirm the larger disk was visible inside the guest.
- Extend the partition only if the LVM physical volume did not already cover the available device space.
- Resize the physical volume so LVM recognized the added capacity.
- Confirm free extents appeared in the volume group.
- Extend the root logical volume.
- Grow the filesystem using the tool appropriate to its type.
The root filesystem was eventually expanded to approximately 146 GB. That value was an outcome of this VM’s layout, not a number another system should copy.
Verifying recovery
After the storage work, I repeated the same observations instead of assuming success:
lsblk
df -h
sudo pvs
sudo vgs
sudo lvs
kubectl describe node <node-name>
kubectl get pods --all-namespaces
The block, LVM, and filesystem views now agreed about the expanded capacity. I then waited for the kubelet to update the node condition and verified that DiskPressure cleared before expecting normal scheduling.
If a condition persists, capacity alone may not be the complete fix. Inode exhaustion, image filesystems, eviction thresholds, or continuing rapid writes can keep pressure active. The Kubernetes condition should be treated as an observed signal, not manually wished away.
What I learned
The incident was not caused by Proxmox “forgetting” the disk or Kubernetes misreporting storage. The capacity existed at the virtual-disk layer but had not propagated through partitioning, LVM, and the root filesystem.
The durable lesson was to compare layers before acting. df -h and the Proxmox UI answer different questions. lsblk, pvs, vgs, and lvs connect those answers. Kubernetes then explains how the filesystem state affects scheduling.
DiskPressure was the visible symptom. The fix came from following storage ownership all the way down.